World-class charting to fine tune your market timing
You can use Alpha's outstanding charts and analytics to identify underlying trends, anticipate breakouts and time market entry and exit.
OUTSTANDING CHARTING
Alpha includes a comprehensive suite of chart styles and analytics which can be applied to both historical and real-time price charts.
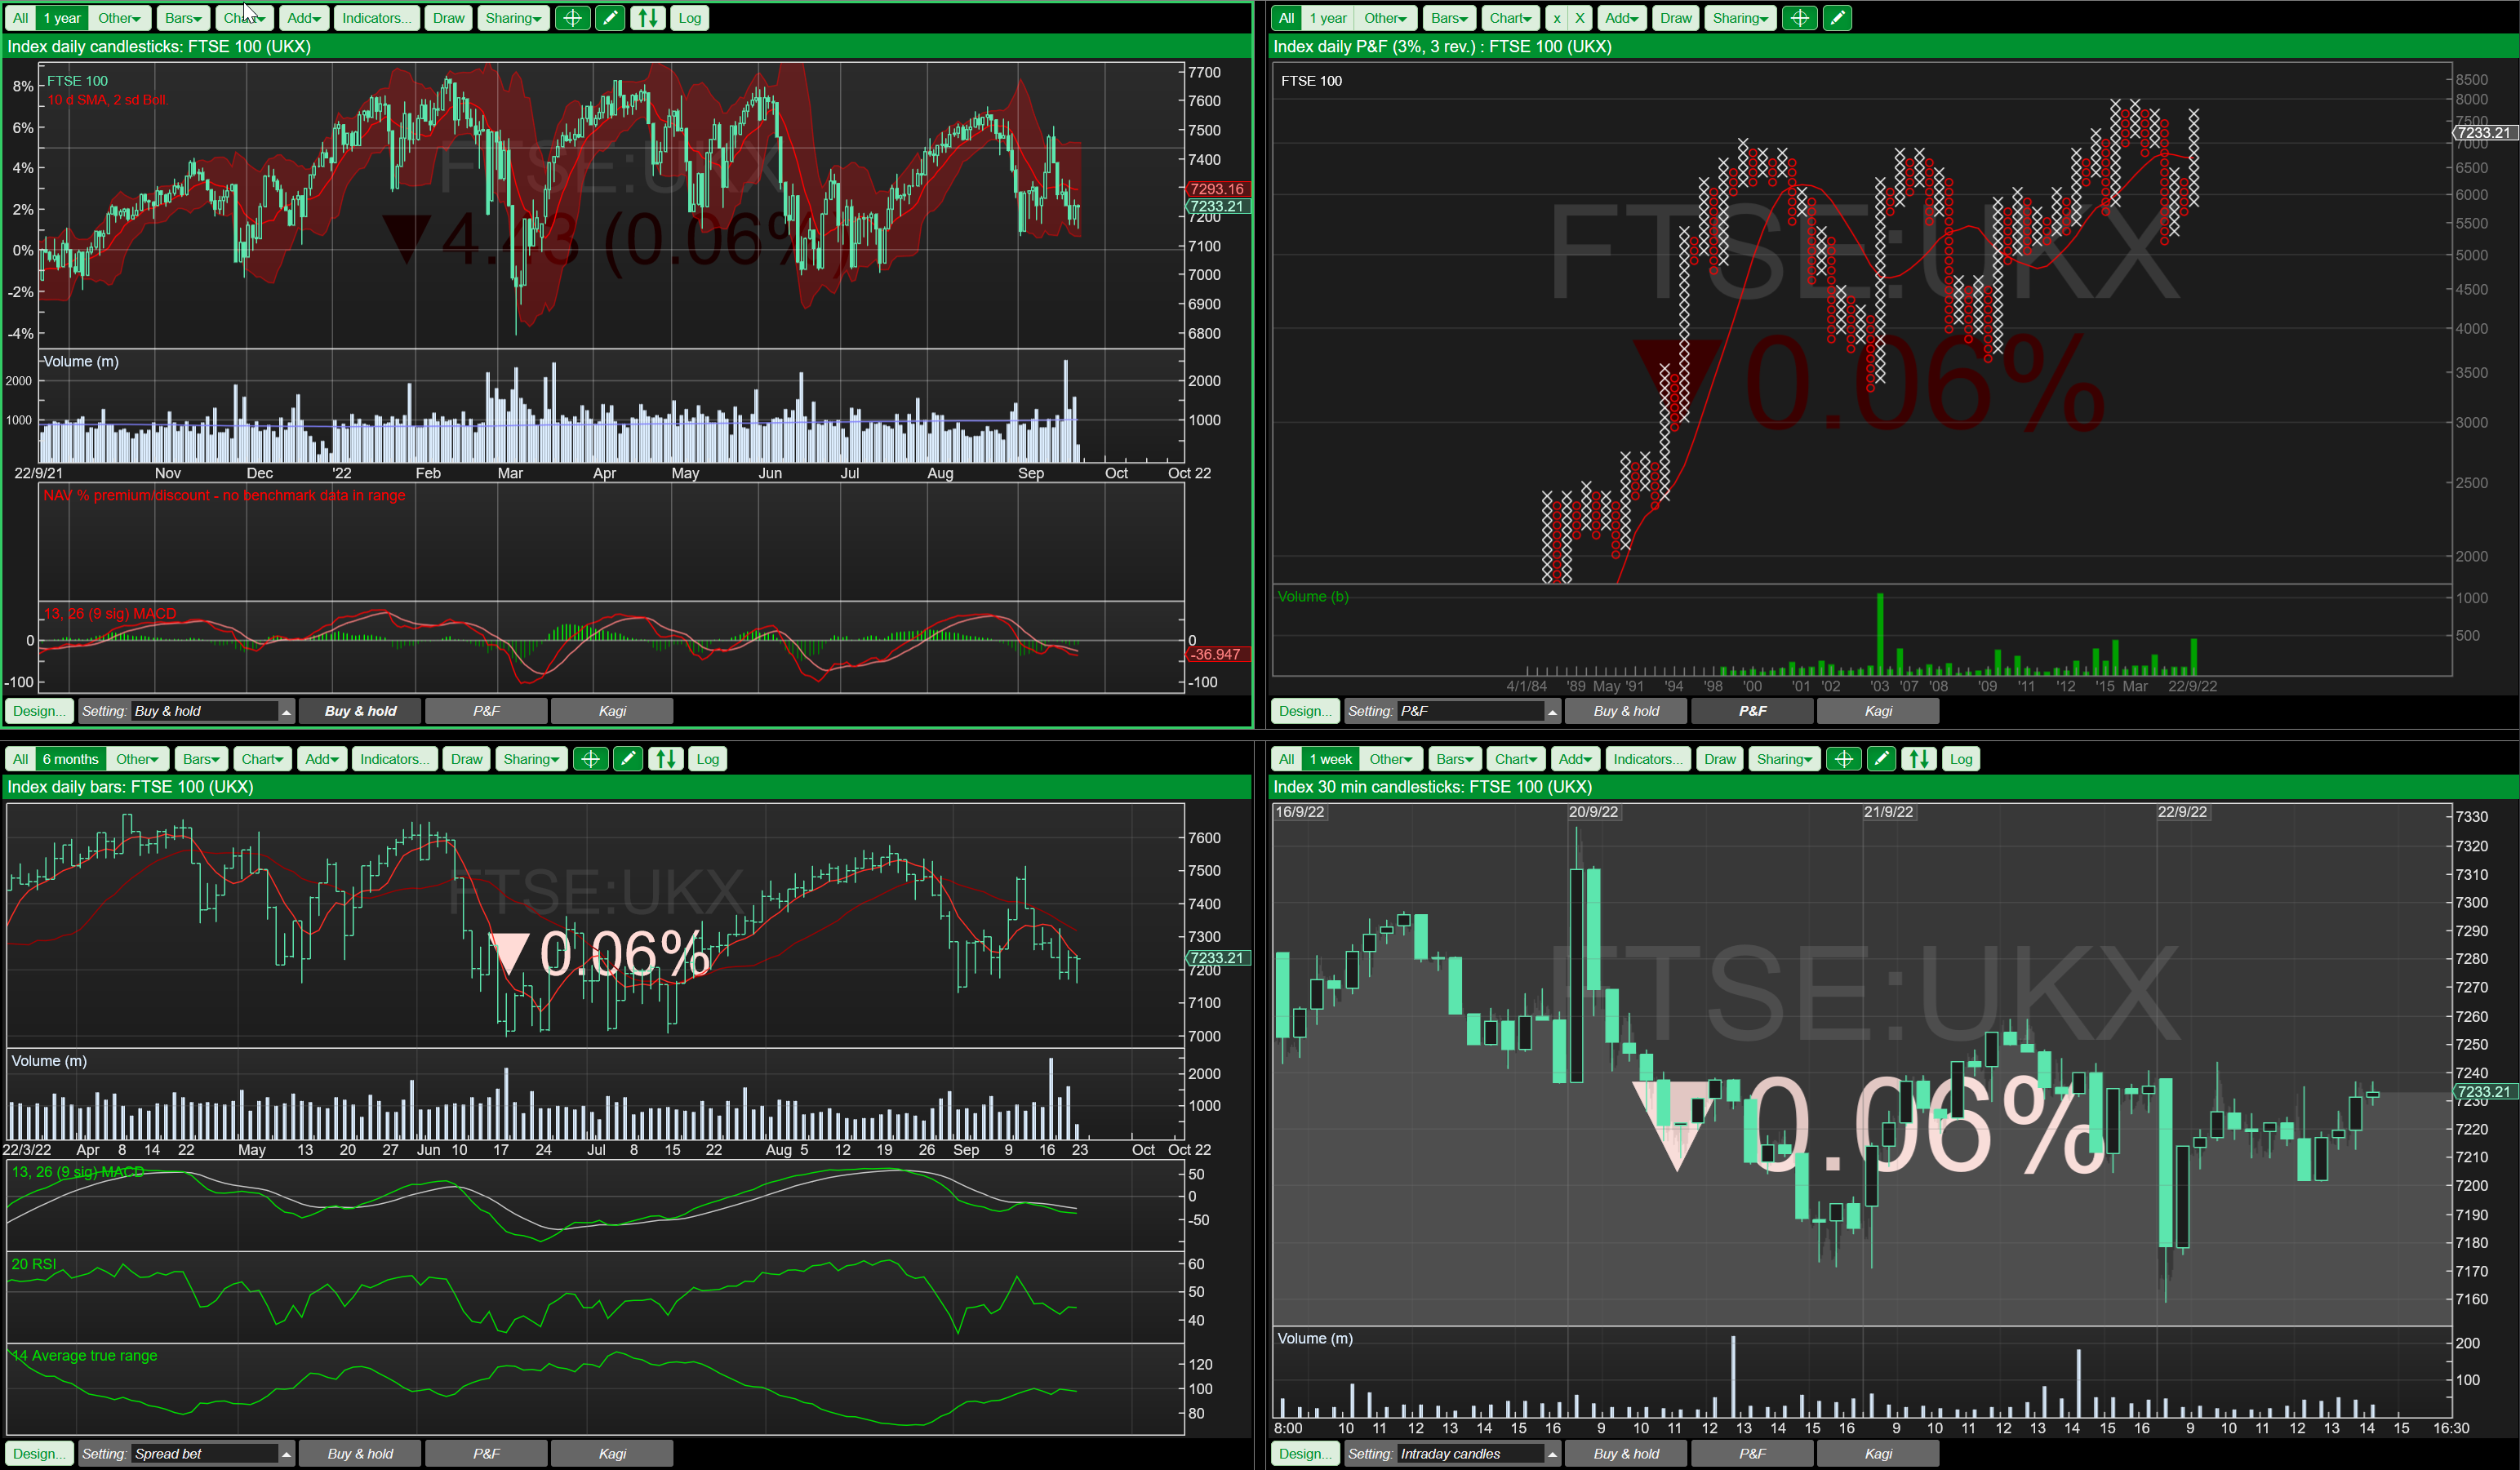
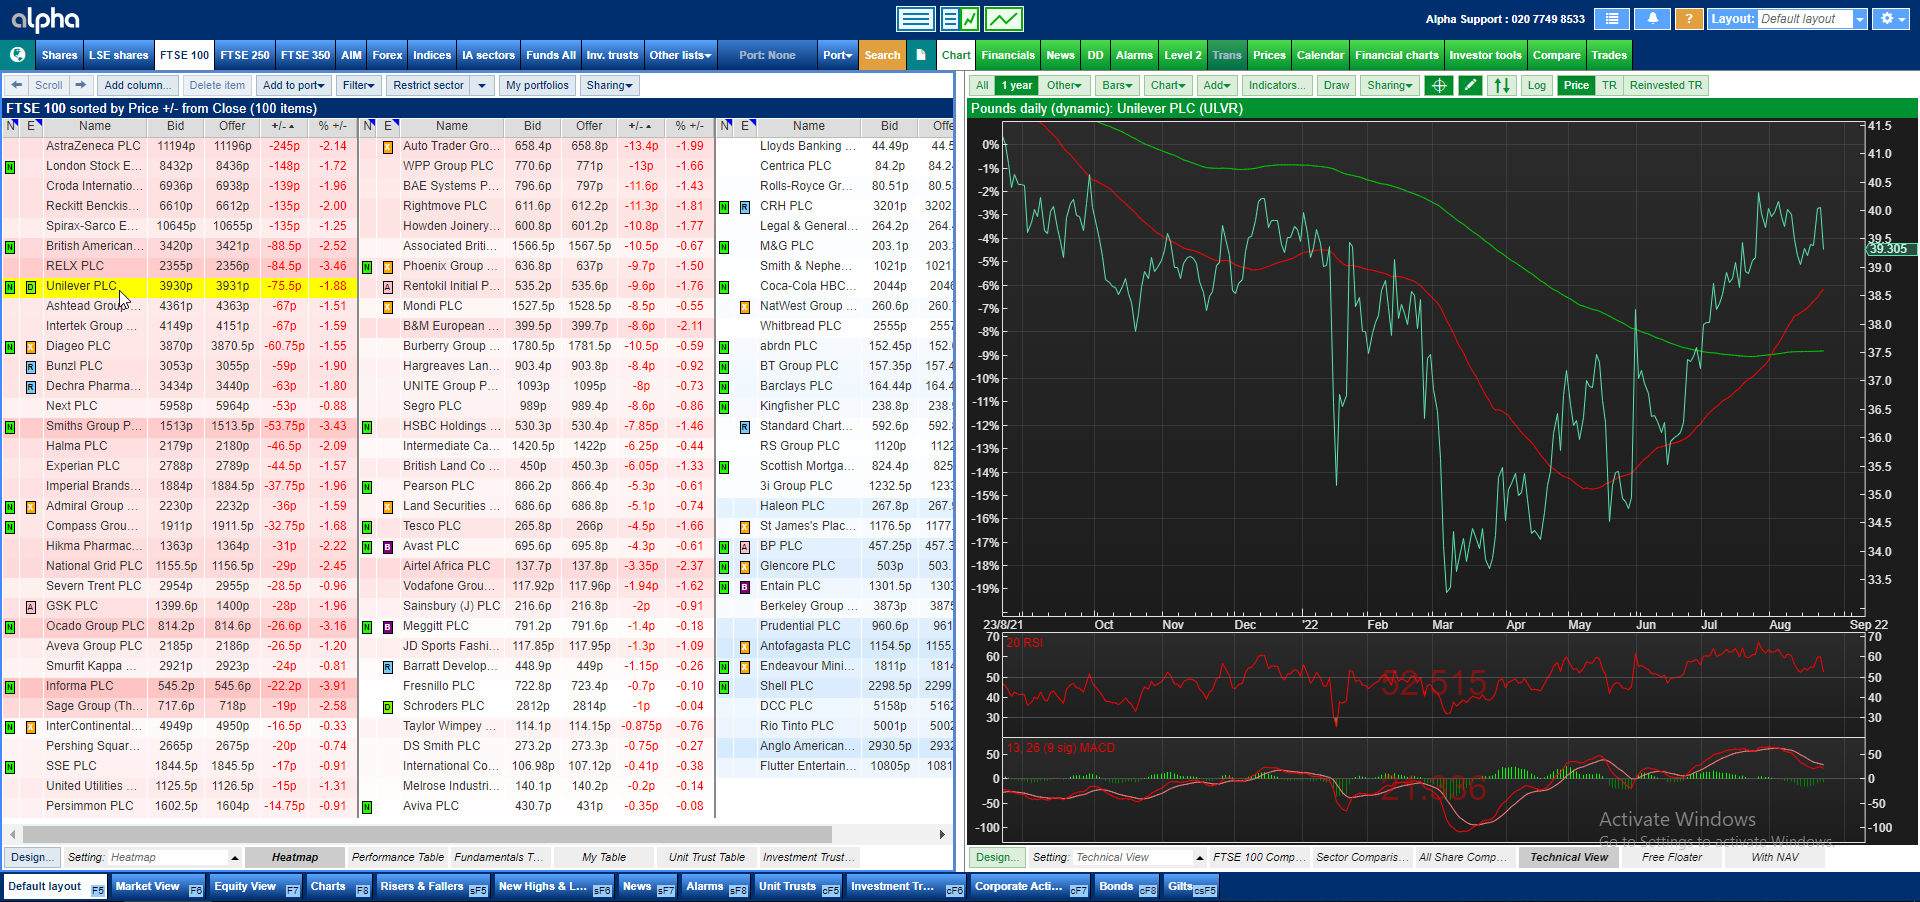
Clients are impressed by how easy it is to review stocks using different analytics, and how quickly they can scan through a list of shares such as the FTSE 100 or a portfolio.
"I use charts heavily and Alpha Terminal has far superior charting tools to other data terminals." Investment Director
FLEXIBLE CHARTING AT YOUR FINGERTIPS
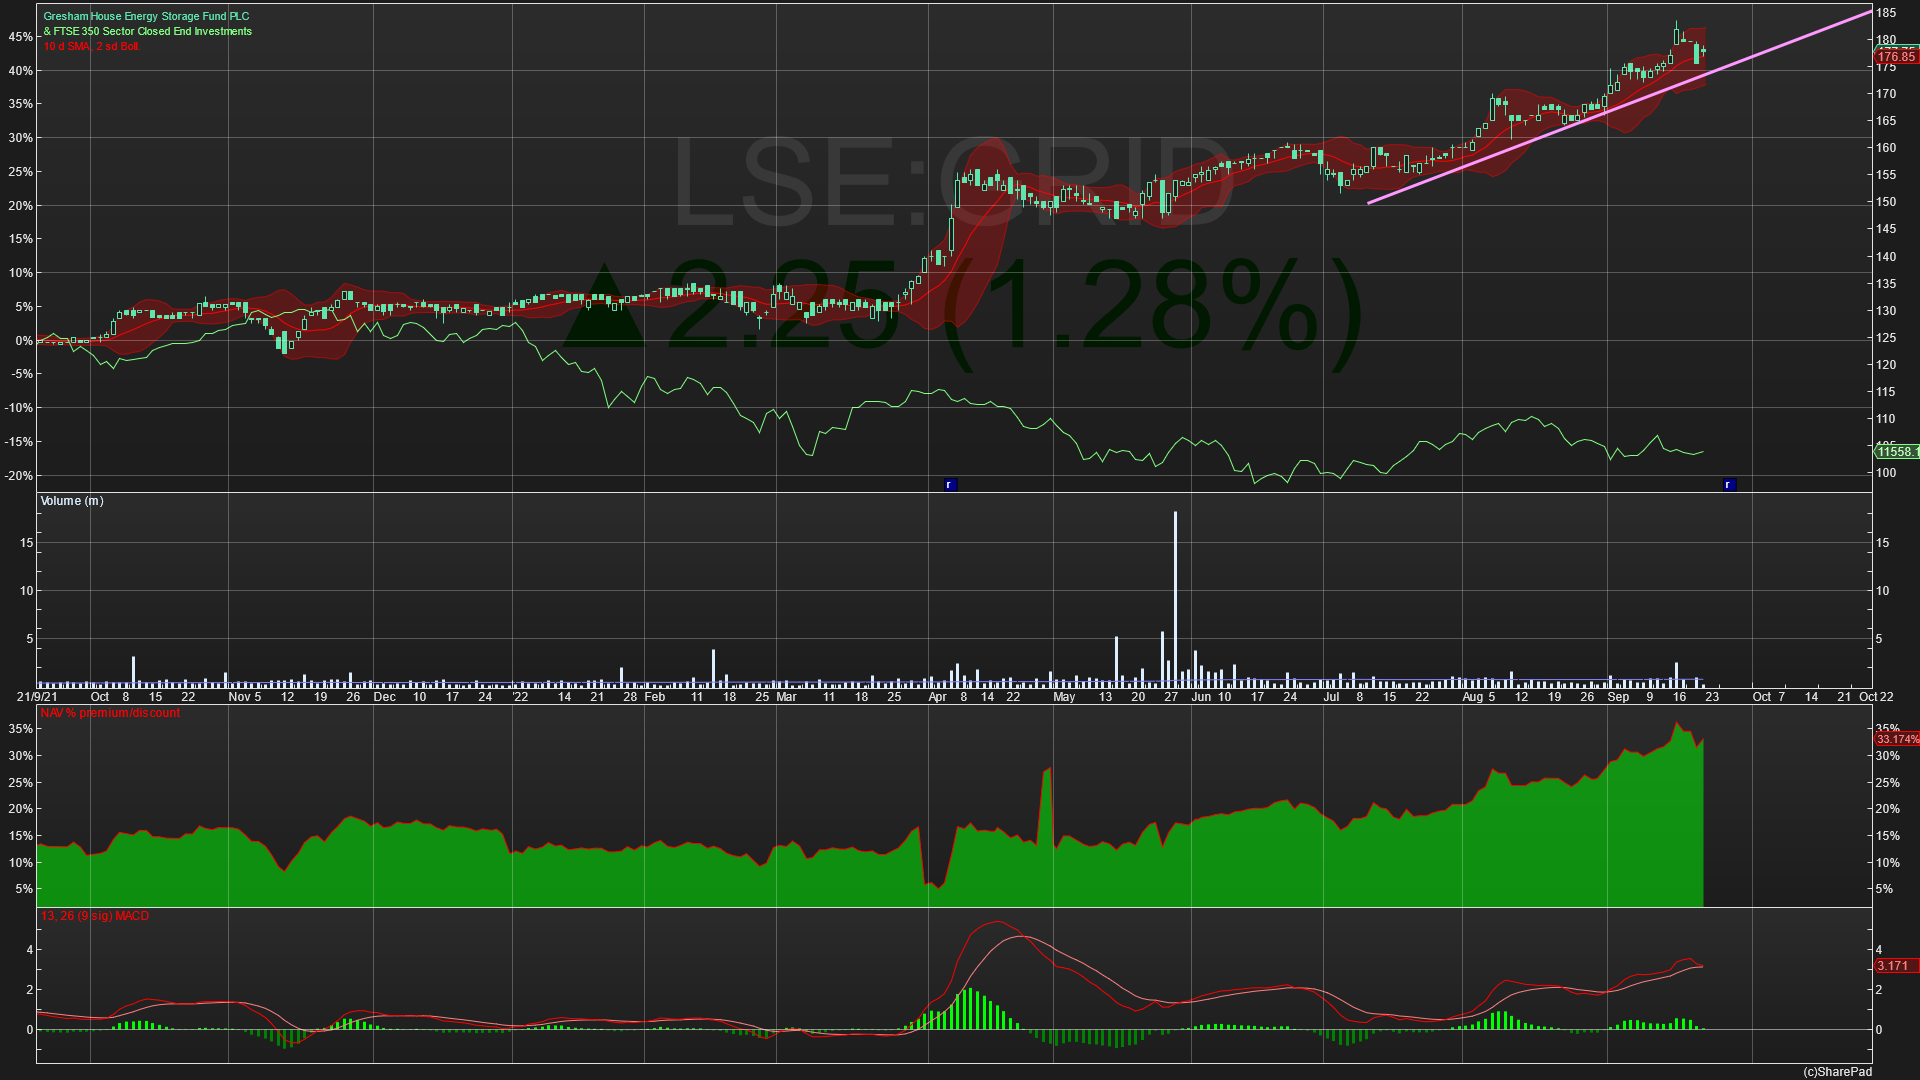
A great feature of Alpha is the ability to draw your own support, resistance and trend lines on historical and intraday price charts. The lines and comments you add to charts will be automatically saved.
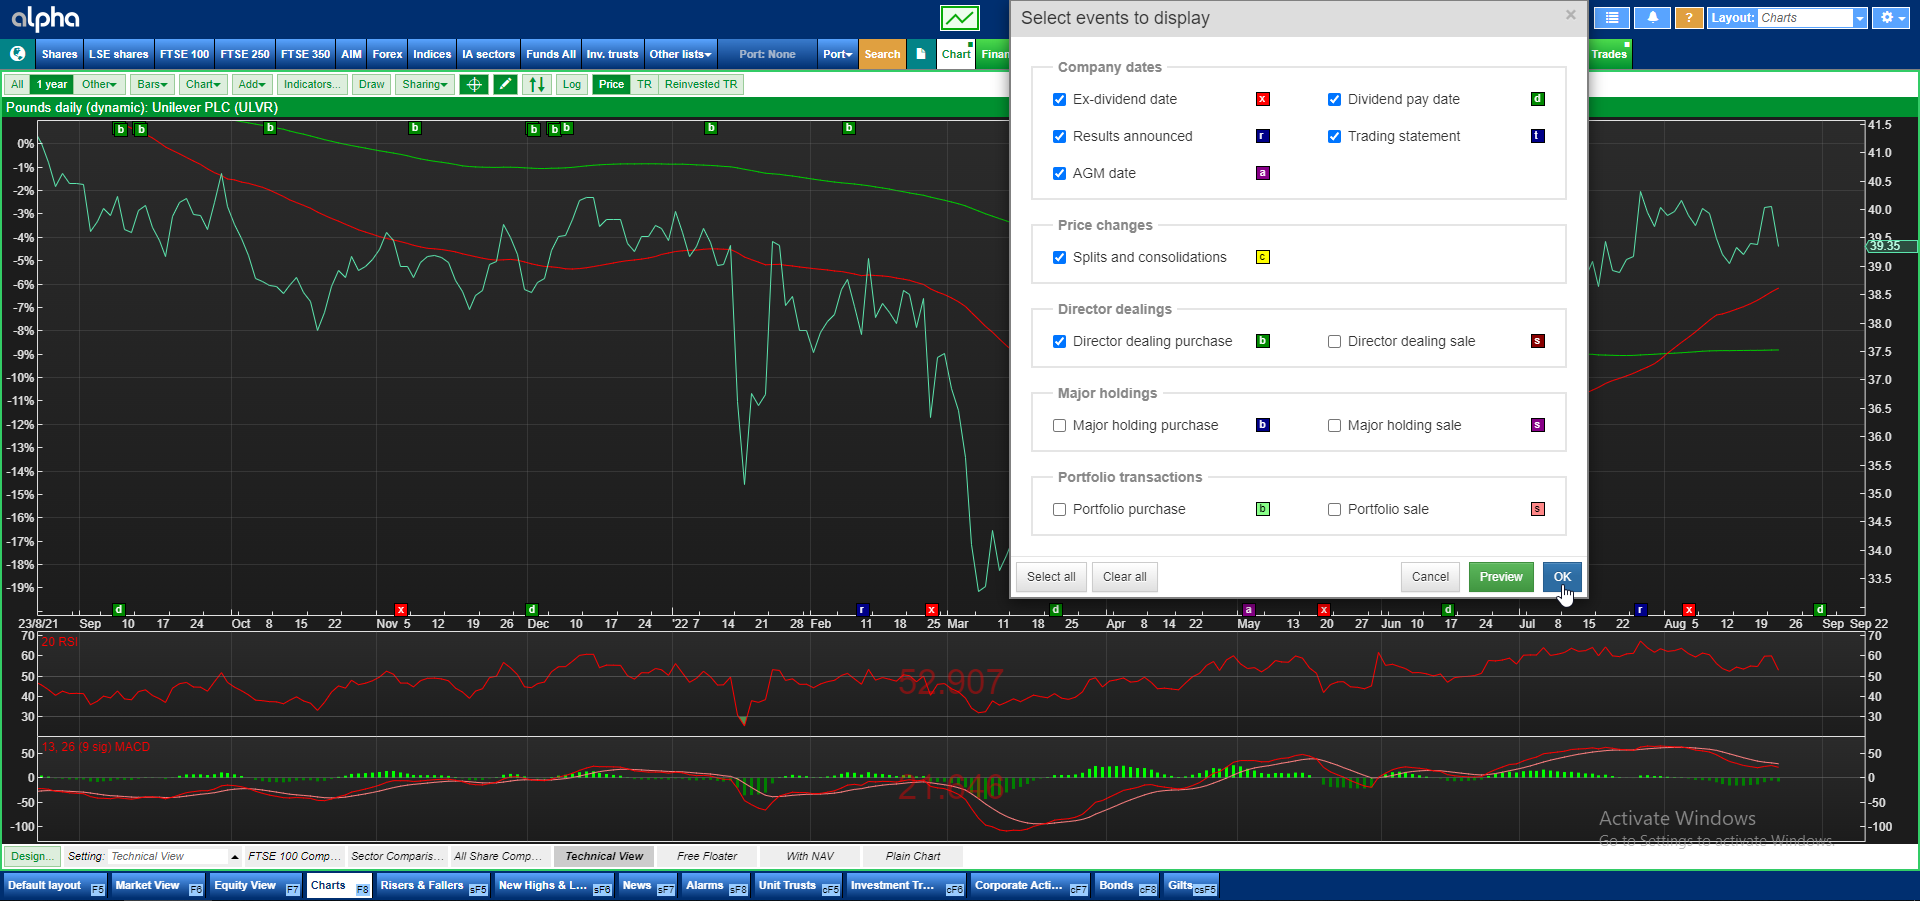
On price charts you can overlay key company dates, such as Results and ex-dividend dates, details of directors' dealings, and, if you manage a fund or portfolio, transaction dates.
"I can actually set up alarms so that an alert is sent not just to me but to the client as well." Long-term Alpha client
COMPREHENSIVE LIST OF CHART TYPES AND ANALYSIS AVAILABLE
Alpha's comprehensive technical analysis suite includes the following chart types and analytics:
- Candlestick
- Close Line
- Kagi
- Mid Line
- OHLC
- Point & Figure
- Simple Moving Average
- Exponential Moving Average
- Weighted Moving Average
- Volume Weighted Moving Average
- Exp. Vol. Weighted Moving Average
- Triangular Moving Average
- Variable Moving Average (VHF)
- Variable Moving Average (CMO)
- VIDYA Moving Average
- Trend Moving Average
- Bollinger Bands
- Envelopes (Trading Bands)
- STARC Bands
- Keltner Channels
- Fibonacci Arc
- Fibonacci Fan
- Fibonacci Time
- Fibonacci Retracement (Extension)
- Gann Angles
- Ichimoku Charts
- Partial Trend
- Pivot Points
- Price Channels
- Quadrant Lines
- Speed Resistance Lines
- Swing Charts
- Trend & Confidence Lines
- Zig-Zag Charts/Lines
- V-Line
- U-Line
- Wave Analysis
- Accumulation/Distribution
- Adaptive Stochastic Oscillator
- Aroon
- Average True Range (ATR)
- Balance of Power
- Beta
- Bollinger Bandwidth
- Chaikin Oscillator
- Chande Momentum Oscillator
- Chande Trend Index
- Choppiness Index
- Commodity Channel Index (CCI)
- Connors RSI
- Coppock
- Correlation
- Directional Movement (ADX)
- Ease of Movement
- Elder Force Index
- MACD (Moving Average Convergence)
- Mass Index
- Meisels
- Momentum
- Money Flow Index
- Negative Volume Index
- Positive Volume Index
- On balance Volume
- Oscillator
- Parabolic SAR
- Price Rate of Change
- Price Relative to
- Relative Vigor Index
- Risk Analysis
- RSI
- Standard Deviation
- Stochastic Oscillator
- Traders Dynamic Index
- Trend Analysis
- TRIX
- True Strength Index
- Ultimate Oscillator
- Up/Down Volume Ratio
- Vertical Horizontal Filter (VHF)
- Volatility
- Volume Index
- Williams Acc/Dist
- Williams' Acc/Dist
- Williams %R
MORE AWARD WINNING REASONS TO SWITCH


Almost all of our client portfolios are now within the top quartile for their sector.
Some of my clients invest in funds and bonds...Alpha provides information for these instruments on one platform.
Alpha is by far the best investment information terminal I have ever used.
A top class product backed by very knowledgeable staff.
Alpha includes far superior charting tools to other data terminals.
Many of my colleagues use Bloomberg but, for what I need, Alpha is excellent.
About Us
Ionic Information Limited is a specialist in financial software. Focused on the UK professional investment sector, Ionic's primary goals are to make it easier to access and interpret market data. By making analysis faster and more efficient, our products make successful investment decisions more likely. By making access to data faster for customer-facing professionals, we help our clients provide even better customer service to their clients.
Our products are widely used by investment managers, wealth managers, fund managers, IFAs, retail brokers and proprietary traders.
Ionic is a privately-owned UK company based in London.